Pixel-perfect Multi-DPI Images in WPF (Part 3)

View source on GitHub.

In Part 1 of this series, I discussed the problem of displaying different bitmap images at different DPIs in WPF. In Part 2, I proposed a solution using multi-frame TIFFs and two simple markup extensions. In this final post I will present a basic program that takes multiple images (PNG recommended), gives the option to specify the DPI of each and generates a multi-frame TIFF file accordingly.

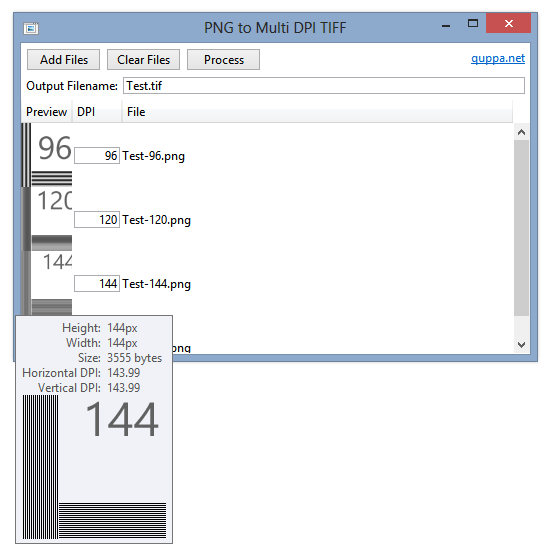
Screenshot of PNG to Multi-DPI TIFF Program

I think the UI is self-explanatory. The program attempts to provide an output filename based on the pattern of the names of the input files. Alternatively, you can specify an absolute or relative file URI of your own.

Add files to the list by dragging and dropping them onto the window or click ‘Add Files’. Hovering over an image will display the unscaled image (to a point) in a tooltip, as shown above.

As mentioned in the previous post, avoid using PNGOUT or the like to compress your images – the Windows TIFF decoder has some issues displaying TIFF files made from highly-compressed PNGs.

Apologies to Microsoft for nicking an icon from imageres.dll.

The download includes the program binary (signed) and source (which isn’t particularly well structured or documented).

PNGToMultiDPITIFF.7z
156,593 bytes; SHA-1: 4CD2D2A7F7CE124A95D7900CBE89CAA1E0310790
Pixel-perfect Multi-DPI Images in WPF (Part 2)

View source on GitHub.

See also: Part 1 and Part 3.

In Part 1 of this series, I explored the issue of displaying pixel-perfect bitmap images in the Windows Presentation Foundation. In this article, I’ll describe a method of displaying different images depending on the system DPI setting using a custom Markup Extension and multi-image TIFF files.

Tagged Image File Format (TIFF) files may contain multiple images, and WPF contains support for this format out of the box. You can use the TiffBitmapEncoder class to combine multiple images into one TIFF – I made a tool called PNGToMultiDPITIFF that does just this, but I’ll leave that to Part 3.

To pick the best-matching image from a multi-frame TIFF, I created two Markup Extensions – one for creating an ImageSource, and one for setting the image’s BitmapScalingMode. If the TIFF contains an exact match for the current DPI, the BitmapScalingMode can be set to NearestNeighbour (as there should be no scaling). If not, it will be set to ‘Unspecified’ (which means ‘Linear’ in WPF 4 or newer) so it looks better.

MultiDPIImage.7z
1,229 bytes; SHA-1: BB0B8867C48ECEADD7655E792DAA780A30299747

You can download the code for the Markup Extensions above.

As discussed in the previous post, remember to set UseLayoutRounding and SnapToDevicePixels to true on your Windows.

Code Discussion

The code for the markup extension is quite simple. To get the image frames, we use the TiffBitmapDecoder class:

We loop through the frames to see if any match the system DPI. If there is no exact match, the first frame with a DPI above the system DPI is selected. If there is no such frame, we just pick the frame with the highest DPI.

The code for choosing the BitmapScalingMode is similar – instead of returning an image, we return ‘NearestNeighbour’ if there is an exact DPI match or ‘Unspecified’ otherwise. If you want to use a different BitmapScalingMode fallback, you can specify an optional second paramater in MultiDPIImageScalingMode:

Drawbacks

  • Images set with the markup extension will not be visible in the WPF designer (Visual Studio or Blend). I’d welcome any suggestions on how to fix this.
  • Avoid using PNGOUT or PNGGauntlet on PNG images before putting them into multi-frame TIFF files. The Windows TIFF decoder has some issues with compressed PNGs.

Pixel-perfect Multi-DPI Images in WPF (Part 1)

View source on GitHub.

See also: Part 2 and Part 3.

I’ve written previously about DPI-awareness in the Windows Presentation Foundation and how to specify measurements in pixels rather than Device Independent Units (DIUs). Something else to consider is image scaling – unlike the Windows Ribbon control or WinRT, WPF has no in-built mechanism for displaying different images according to the system’s DPI setting. This is a nuisance.

To illustrate the problem, I created 5 images. Left-to-right, the image DPIs (vertical and horizontal) are: 72, 96, 120, 144 and 192. The image dimensions are: 32x32px, 32x32px, 40x40px, 48x48px and 64x64px. I purposely used single-pixel-wide lines to make any stretching obvious.

Original Images

Read on to see what WPF does with these images.

Continue reading “Pixel-perfect Multi-DPI Images in WPF (Part 1)”

Pixel Measurements in WPF

Part of the beauty of the Windows Presentation Foundation is that it is designed to be resolution independent – that is, a WPF application should scale perfectly no matter the system’s DPI setting (excluding any bitmap graphics, which mightn’t look as nice as the vector parts).

Instead of measuring things in pixels, WPF uses Device Independent Units (DIUs). If you only ever use 96 DPI (100%), you won’t notice the difference: at that setting, 1 pixel is the same as 1 DIU. Increase the system DPI, though, and this will no longer hold true. For example, at 120 DPI (125%), 1 DIU will be represented as 1.25 pixels. At 144 DPI (150%), 1 DIU = 1.5 pixels. At 192 DPI (200%), 1 DIU = 2 pixels.

Notice that at 120 DPI and 144 DPI, the number of pixels in 1 DIU is not an integer. In cases like these – when edges fall in the middle of screen pixels – WPF uses anti-aliasing by default. This can, however, result in lines that seem blurry (after all, that’s what anti-aliasing does). If this behaviour is undesirable, one can use UIElement’s SnapsToDevicePixels property.

WPF’s built-in handling of DPI scaling is great: in most cases, it should be transparent to both the programmer and user.

Sometimes, though, one might want to measure lengths in pixels, not DIUs. For example, Keiki’s custom window border for when the DWM (Aero) is disabled needs to be 1 pixel thick at any DPI (this is how the system’s notification area applications look). So, how can we specify this?

First, we need to get the system’s DPI setting:

dpiX and dpiY will hold values like 1.0 (96 DPI), 1.25 (120 DPI), 1.5 (144 DPI) and 2.0 (192 DPI).

To specify a pixel measurement, we simply divide the DIU measurement by the DPI factor (dpiX and dpiY should always be the same – at least in Windows 7 and earlier):

This will make the margin 3 pixels thick at any DPI. (For example, at 120 DPI, dpiX = 1.25. 3 / 1.25 = 2.4 DIUs. 2.4 DIUs will be converted by WPF to 3 pixels.)

Fedir Nepyivoda has a neat solution to this problem: instead of manually converting DIU measurements, he created a PixelBorder control (inheriting from Border) that overrides MeasureOverride. Have a look here.

Scaled Study Score Interpolation in the Study Score Archive

As I previously mentioned, this year’s release of the Study Score Archive will feature estimated scaled scores alongside raw scores. Helpfully, VTAC provides scaling data in the annual Scaling Report, but correspondences between raw scores and scaled scores for each subject are provided only for scores that are greater than 20 and are multiples of 5 (that is, for the raw scores of 20, 25, 30, 35, 40, 45 and 50). As such, it is necessary to somehow estimate the correspondences for the remaining raw scores. This process in general is called interpolation.

A simple method of interpolation is linear interpolation. This is the approach used by Daniel15’s VCE ATAR Calculator, and it is the approach that I will be using in the 2010 release of the Study Score Archive. Other methods might produce more accurate results, but they are harder to implement and without more data it’s not possible to verify which method of interpolation produces the best results.

To illustrate the process, let’s take a look at the scaling of Further Mathematics in 2010 (for scores of 40 and above).

Continue reading “Scaled Study Score Interpolation in the Study Score Archive”

VCE Study Score Archive: Improvements for 2010

The number of years since I finished VCE continues to increase, but I still plan to publish my Study Score Archive once results are released in the near future.

There will be one major additional feature this year: scaling of scores. Newspapers only publish raw scores, which can be misleading: a raw score of 40 in Latin contributes much more to one’s ATAR than a raw score of 40 in Business Management does. This year I will be incorporating data from the Scaling Report published by VTAC to generate a separate set of lists made with scaled scores.

As always, this sort of data should be interpreted cautiously. Consider:

  1. Calculated scaled scores are estimates only.
  2. A raw score of 39 in Latin scales to somewhere between 50 and 52, but it will be missing from the data. Meanwhile, a score of 40 in Business Management (which scales to around 37) will be present.

Lists using scaled scores will be included in addition to the standard raw score lists, not in place of.

I don’t have access to the scaling reports for all the years included in the archive. Lists using scaled scores will only be present for 2006 onwards (unless someone can send me the reports for earlier years).